Why Choose a DC Fast Charging Station for Your Business?
A Dc Fast Charging Station can turn a business car park into a practical stop for drivers who need a quicker charge. Depending on the vehicle and charger, a short visit may add useful range while customers shop, eat, or attend an appointment. The opportunity is growing: the International Energy Agency’s Global EV Outlook 2024 reports that public charging points increased by more than 40% worldwide in 2023, while fast-charger numbers grew by 55%. IEA Executive Director Fatih Birol described the wider shift this way: “The growth of electric cars is unstoppable – globally, one in five cars sold in 2023 was electric.” That matters. More EVs can mean more charging demand, but demand varies by location, traffic, and local charging options.
For business owners, the decision is not only about installing high-power equipment. Grid capacity, installation costs, charger uptime, payment access, and maintenance all shape the real customer experience. A driver arriving with a low battery notices a stalled screen or blocked stall immediately. A dependable station may support customer visits and create charging revenue, though neither outcome is guaranteed. Site-specific usage estimates are essential. Some locations may see steady use; others may struggle to cover operating costs. That is the part worth questioning before investing. This guide examines the practical reasons to choose a Dc Fast Charging Station, the trade-offs to assess, and the details businesses should verify before committing.
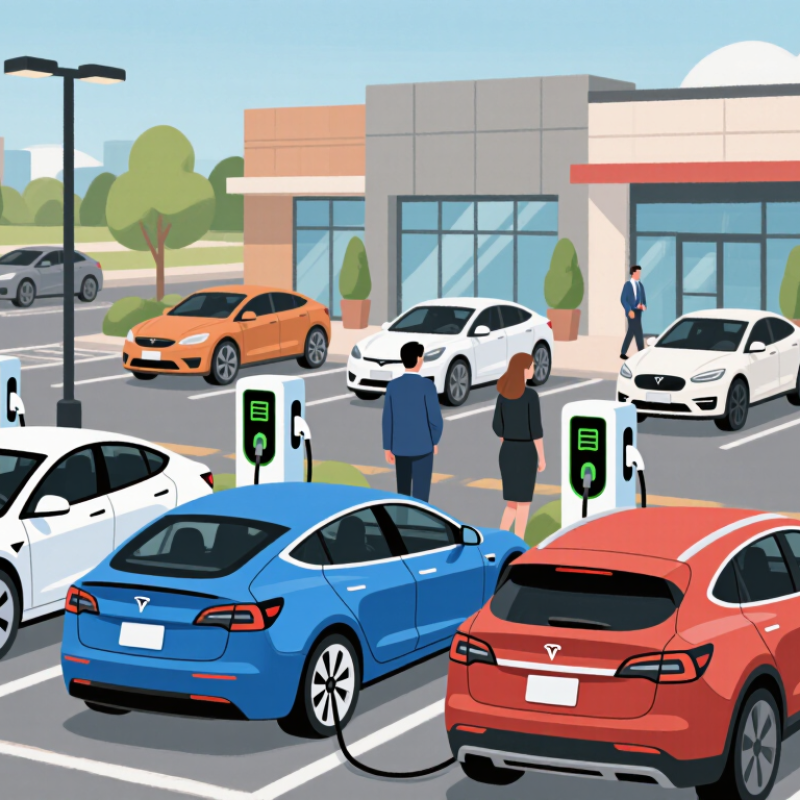
What Defines DC Fast Charging: 50–350 kW Output (U.S. DOE)
For business planning, 50–350 kW is a useful range for DC fast charging. The U.S. Department of Energy’s Alternative Fuels Data Center classifies DC fast charging as 50 kW or higher. Actual speed depends on the vehicle’s charging limit, battery temperature, and charger output.
A 150 kW unit cannot make every car accept 150 kW. That distinction matters. A charger’s rating describes its potential, not the power every driver will receive.
The International Energy Agency’s Global EV Outlook 2024 reports that public fast-charger stock grew by 55% in 2023. For a business, that growth makes site planning more relevant, but it does not mean the highest rating is always the best fit.
A 50 kW charger may suit longer visits; higher output can better serve brief stops or fleet turnover. Yet grid capacity, demand charges, installation costs, and utilization all affect returns.
An idle 350 kW unit is expensive headroom. A queue at 50 kW is a different problem. Track dwell times and peak arrivals before selecting output. Real operating data can be messy, and a tidy specification sheet will not resolve every uncertainty.
How DCFC Delivers 80% Charge in 20–60 Minutes (U.S. DOE)
A DC fast charging station can turn a parking space into a useful stop, not just a place to wait. The U.S. Department of Energy’s Alternative Fuels Data Center says DC fast charging can typically bring an EV to about 80% in 20–60 minutes. That window can suit a quick meal, a grocery run, or a short appointment. Not always. Charging speed depends on the vehicle, battery temperature, starting charge, and charger output. Power also tapers as the battery approaches full.
The International Energy Agency’s Global EV Outlook 2024 reports that public charging points worldwide grew by over 40% in 2023, while fast-charger stock rose by 55%. That points to a growing charging network, but it does not guarantee a profitable site. For a café, hotel, or busy retail lot, a 20–60-minute stop may fit customers’ existing plans. I would avoid promising every driver a 20-minute charge. A cold morning, a nearly full battery, or shared site power can extend the wait. Good planning starts with actual customer dwell times, available electrical capacity, and the vehicles drivers bring.
Why Choose a DC Fast Charging Station for Your Business?
DC fast charging can bring an EV to approximately 80% charge in 20–60 minutes, according to the U.S. Department of Energy.
Actual charging time varies by vehicle, battery temperature, starting state of charge, and charger power. The 20–60 minute range is an estimate, not a guaranteed charging time.
Source: U.S. Department of Energy (DOE).
Why Business Demand Is Rising: Fast Chargers Grew 55% in 2023 (IEA)
Why Choose a DC Fast Charging Station for Your Business?
The International Energy Agency reported that public fast-charging points grew by 55% in 2023. That sharp rise reflects changing driver needs. People want useful charging while they shop, eat, work, or travel—not only overnight at home.
For a business, a DC fast charger can turn a short visit into a practical charging stop. A driver might arrive with a low battery, plug in, and grab a coffee while the vehicle charges. The right location matters: sites near busy roads, retail areas, or workplaces may be better suited to quick sessions. Check local traffic patterns and likely dwell times before choosing equipment. A charger that sits idle is still an expense.
Growth is encouraging, but it is not a promise of profit. That number is a signal, not a guarantee. Installation costs, electrical capacity, maintenance, and customer habits all affect results. Even a well-placed station may take time to attract regular users. I’d review usage data after launch and adjust pricing or signage where needed. Some assumptions will be wrong. That is part of planning, too.
How to Evaluate Business Returns: Utilization, Demand Charges, and Revenue
Why Choose a DC Fast Charging Station for Your Business?
How to Evaluate Business Returns: Utilization, Demand Charges, and Revenue
A fast charger’s business case depends less on its headline power rating than on how often drivers use it. Track expected sessions by hour, average charging time, and energy delivered per visit. A charger beside a busy highway may see sharp evening peaks, while one at a workplace may sit idle for much of the day. Use local traffic and parking patterns, not optimistic estimates alone. The meter matters.
Demand charges can change the calculation. Some electricity tariffs add fees based on the highest power draw during a billing period. If several vehicles charge at once, one short peak may raise the monthly bill. Ask the utility for the applicable tariff, then model quiet and busy months. Include connection upgrades, maintenance, payment processing, and downtime. Small details count.
Estimate revenue from charging fees, but compare it with the full cost of delivering each kilowatt-hour. A simple spreadsheet can show break-even utilization under different pricing and energy-cost assumptions. Test a cautious scenario, such as fewer sessions or lower average energy per visit. That is not guaranteed. Customer dwell time, nearby alternatives, and reliable uptime all affect demand, and early forecasts may need revision once real usage data arrives.
Why Choose a DC Fast Charging Station for Your Business? — How to Evaluate Business Returns: Utilization, Demand Charges, and Revenue
Illustrative annual operating model for one 150 kW DC fast charging station across three utilization scenarios. | Metric | Low Utilization | Moderate Utilization | High Utilization |
| Usage and Revenue |
| Annual utilization | 10% | 20% | 30% |
| Energy delivered per year | 131,400 kWh | 262,800 kWh | 394,200 kWh |
| Estimated charging sessions per year | 3,754 | 7,509 | 11,263 |
| Average sessions per day | 10.3 | 20.6 | 30.9 |
| Average customer price | $0.45/kWh | $0.45/kWh | $0.45/kWh |
| Estimated annual charging revenue | $59,130 | $118,260 | $177,390 |
| Operating Costs and Demand Charges |
| Electricity cost assumption | $0.15/kWh | $0.15/kWh | $0.15/kWh |
| Estimated annual electricity cost | $19,710 | $39,420 | $59,130 |
| Network and transaction fees | $0.04/kWh | $0.04/kWh | $0.04/kWh |
| Estimated annual network and transaction fees | $5,256 | $10,512 | $15,768 |
| Assumed billed peak demand | 60 kW | 100 kW | 130 kW |
| Demand charge assumption | $18/kW-month | $18/kW-month | $18/kW-month |
| Estimated annual demand charges | $12,960 | $21,600 | $28,080 |
| Annual maintenance and fixed operating costs | $12,000 | $12,000 | $12,000 |
| Indicative Business Returns |
| Estimated annual operating contribution | $9,204 | $34,728 | $62,412 |
| Illustrative installed project cost | $120,000 | $120,000 | $120,000 |
| Simple payback period | 13.0 years | 3.5 years | 1.9 years |
Planning example, not a market quote or earnings guarantee. Assumptions: 150 kW station operating year-round; average session delivers 35 kWh; customer price is $0.45/kWh; electricity costs $0.15/kWh; network and transaction fees are $0.04/kWh; demand charges are $18 per billed kW per month; and annual maintenance and fixed operating costs are $12,000. Billed peak demand assumes managed charging and varies by scenario. The $120,000 installed cost is illustrative. Simple payback equals installed cost divided by annual operating contribution and excludes financing, taxes, incentives, depreciation, site lease costs, and other location-specific expenses. Actual utility tariffs, load profiles, prices, and project costs vary.
How to Plan Deployment: Grid Capacity, Connector Standards, and Site Design
A DC fast charging station can serve drivers who need a quick stop, but deployment starts with the site’s electrical capacity. Ask a qualified electrical professional to review utility service, transformer limits, and existing peak loads. A charger’s rated output is not the same as power your site can reliably deliver. Load management may reduce upgrade costs, though it cannot create capacity that is not there. Get the numbers early.
Connector standards matter for everyday access. Check which connector types local vehicle owners use, and confirm that planned equipment supports the vehicles you expect to serve. Standards and vehicle fleets can change, so avoid basing a long-term decision on one season of traffic data. That estimate may be wrong.
Walk the site at busy times. Drivers need clear signs, safe entry and exit, and enough space to approach charging stalls without blocking other vehicles. Consider cable reach, curb placement, lighting, drainage, and accessible routes. Keep electrical equipment protected from vehicle impacts and weather. A tidy drawing can miss a real bottleneck: delivery vans, parked cars, or a queue near the entrance. Revisit the layout with staff who know how the site actually moves.